

The Golden Era of Epidemiologic Models – Understanding their Role in Managing the COVID-19 Pandemic
May 1, 2020
Mathew Reeves PhD | Professor of Epidemiology and Biostatistics
Michigan State University
Even in the early phases of the 2020 COVID-19 outbreak it’s easy to pick out some of the initial winners of this global pandemic – Zoom, epidemiologists, Netflix, social distancing, hand sanitizer, PPE, and remote work are all on the shortlist, but for this article, I will concentrate on the clear scientific front runner – epidemiological modeling. In this post I will discuss four critical features of epidemiological models: purpose, uncertainty, dynamics, and perspective. And I will argue that there is a critical need for modelers to take a broader, societal perspective to inform the current public debate about how we should manage this health crisis.
Before this pandemic only a handful of academic public health and epidemiology departments across the world housed bona-fide groups of scientists specializing in the arcane world of infectious disease modeling. These investigators spent much of their time studying past outbreaks to generate models that could predict the spread and impact of future pandemics.[1] Of course, occasionally such models provided critically useful information during an active epidemic such as the slow-moving AIDS epidemic,[2] the virulent Ebola epidemics,[3] or the rapid spread of Foot-and-Mouth disease in animals.[4] But the focus of modelers on the risk of some future pandemic could make them appear more like false prophets peddling the next doomsday apocalypse, and so despite their steady drum beat of concern they have been largely ignored.
History and overview of epidemiological modeling:
Epidemiologic models of infectious disease have a long history, starting with the writings of eminent mathematician Daniel Bernoulli (1700-1782) who studied the benefit of vaccination against small pox.[5] The foundations of modern-day epidemiologic mathematical models – referred to as compartment models -- were first proposed in 1927 by Kermack and McKendric from Edinburgh, Scotland. The most basic compartment model is the SIR model (illustrated in Figure 1 and 2) which categorizes every member of a population into one of 3 mutually exclusive states: susceptible (S), infected (I), and recovered (R).[6] Using ‘simple’ differential equations it is possible to model how a particular epidemic moves through a population, by generating estimates of the size and timing of the peak of infected cases, how long the epidemic will last, and the total number of infections or deaths. Critically, the SIR model can be used to estimate the R naught (Ro) or basic reproductive number which is the number of new infections any one single infectious person produces. The Ro is a critical determinant of whether a disease is going to continue to spread (and how fast) or peter out;[7] a Ro >1 indicates that spread will continue, whereas a value <1 indicates that the epidemic will subside. Although the SIR model is the least complicated form of this class of mathematical models it serves to illustrate how relatively straightforward mathematics can be used to understand the complexities of the spread of infection. While SIR type models are beautifully simple in their design and execution, they have largely escaped the notice of the general public despite their important contributions to disease control.
FIGURE 1. The Basic SIR Model

This diagram illustrates how susceptible (S) members of the population move through the states of being infectious (I) and then recovered (R ). The beta (β) term measures the rate of spread, specifically, the probability of transmitting disease between a susceptible and infectious individual. The gamma (ϒ ) term measures the rate of recovery. The Ro (basic reproductive rate) is estimated by dividing beta by gamma (Ro= β/ϒ). Source: Institute for Disease Modeling (IDM).
https://idmod.org/docs/general/model-sir.html
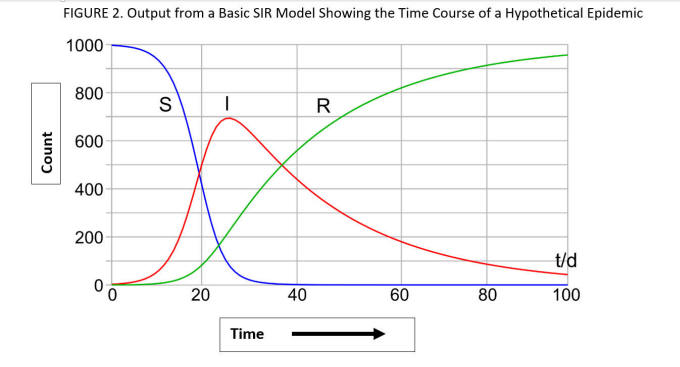
This figure illustrates how the SIR model describes the time course of an epidemic in a hypothetical population of 1000 subjects. At time 0, all 1000 members of the population are susceptible (S). The epidemic begins with a rise in the numbers of infectious (I) individuals as the number of susceptibles declines precipitously. Over time members recover (R ) and the number of S and I individuals subside to zero. Source: By Klaus-Dieter Keller. https://commons.wikimedia.org/w/index.php?curid=77633956
Epidemiological modeling in the age of COVID-19:
What a difference a few weeks have made to this formerly obscure world of infectious disease modelling. Since the start of the epidemic in early January, epidemiologic models have taken center stage in determining how governments have responded to the pandemic. The predictions from these models garner the daily attention of politicians, academics, public health officials, the media, and the general public alike. Currently, there are several different models that get regular scrutiny – including those from Northeastern University (Boston), Imperial College London, Los Alamos National Laboratory, MIT, and Columbia University Some of these models are grounded in the fundamentals of the SIR compartment model described above, while others take very different statistical approaches, and to add further complexity they all vary in the particular set of assumptions they utilize. However, all of them are built with one central goal in mind – to allow epidemiologists to predict the effects that different control strategies (e.g., school closures, home quarantine, stay-at-home orders) have on the extent, duration and overall impact of the epidemic. Regardless of their specific mathematical approach and assumptions, the results of these models are updated and compared regularly, and their specific findings, be it projections of 160 million total infections, 200,000 deaths, or the effects of prolonging stay-at-home orders – now play a central role in informing public health policy. Finally, we should note that it is these models that introduced the concept of flattening the curve (#flattenthecurve) to millions of people, and then convinced them to undertake social distancing and self-isolation en masse – behaviors that would have been viewed as laughably draconian just 10 weeks ago.
Now, let’s discuss four critical features of epidemiological models: 1) The central purpose of models, 2) the inherent uncertainty of models, 3) the dynamic nature of models, and 4) the importance of the model’s perspective. Understanding these four features will help remove some of the confusion and misunderstanding about these models and their central role in managing this pandemic.
The Central Purpose of Models:
All models are a simplification of reality. Epidemics occur in the real world – in the middle of chaotic, infinitely complex systems of biology, social interactions, and medical and public health interventions. It is impossible to make headway against a new epidemic without first reducing its complexity to create a clearer understanding of what the essential drivers of the outbreak are and how they are operating. Without this simplified viewpoint it is impossible to identify the policy alternatives --- the actions (e.g., school closures, face masks, stay-at-home orders) needed to ‘mitigate’ and ‘control’ the epidemic. Modelers know that even the most sophisticated models are a simplification of reality – but that is their very point.
The Inherent Uncertainty of Models:
Most epidemiological models are dependent on only a handful of critical input values including the Ro (basic reproductive number), incubation period (how long it takes to develop symptoms after infection), and the duration of infectiousness (how long an infected person is able to spread the virus to others). (For an example see http://gabgoh.github.io/COVID/index.html). These inputs lead to the second point about models – their results are always uncertain. Any specific output from a model – be it the date of the epidemic’s peak, the total number of deaths, or the duration of the epidemic -- are single point estimates with a wide range of plausible values. This range of values is typically presented in terms of an uncertainty or prediction interval. For example, as of today (May 1st) the Institute of Health Metrics and Evaluation (IHME) model from the University of Washington (https://covid19.healthdata.org/united-states-of-america) predicted that on June 1st the total number of COVID-19 deaths in the US will be 72,129 but with an uncertainty interval of 59,000 to 112,000 (a wide range that likely covers all plausible scenarios). These uncertainty intervals are reported and emphasized by the modelers, but they are frequently ignored by the media and general public. Debating whether an estimate is really 72,000 or 60,000 or 100,000 misses the point – the uncertainty interval tells you that all of those numbers are plausible. Instead, we should focus less on the specific output of the model and more on what these models can tell us about the relative impact of different mitigation and control actions; the specific numbers matter less than how they change in response to alternative inputs to the model.
Another important aspect inherent to the uncertainty of models relates to the accuracy of the model’s critical input values. A model’s output is directly determined by its inputs. For example in the case of the basic SIR model, the specific values chosen for the transmission rate (β) and the recovery rate (ϒ ) (Figure 1), directly impact the shape of the epidemic curves (Figure 2). These values are determined by careful epidemiological study of the populations affected by the outbreak – and in the early stages of an epidemic there is often considerable uncertainty in these values - including the number of people who are infected, when and for how long they show symptoms for, how long they are infectious for, and whether some infected cases show symptoms at all. In the case of a novel virus (SARS-CoV-2) causing a brand new disease (COVID-19) the uncertainty is huge. These inherent uncertainties regarding the specifics of the epidemic further compound the errors already built into these models. But as more is learned about the epidemic (i.e., the nature of the virus, how it spreads) the more confident we can be about the accuracy of these input values – which can then be changed -- leading to a better, more accurate model. Understanding this also serves to illustrate the fundamental importance of disease surveillance and epidemiologic field work – the models are only as good as our fundamental knowledge about the nature of the virus and how the illness is spreading in the population.
The Dynamic Nature of Models:
Debates about how a particular model’s estimates go up or down over time misses another important point about models - they are designed to be dynamic – their value comes from being able to quickly process new information and spit out new estimates. One of the key advantages of models is that the uncertainty in their starting input values can be explicitly modelled using sensitivity analysis. Sensitivity analysis refers to examining how the results of a model change across plausible ranges of a given input. For instance, a sensitivity analysis of a COVID-19 model could tell modelers that small shifts in duration of the infectious period impact the model’s outputs far more than small changes in the incubation period. Not all inputs will be as important as others, so the modeler can then identify which input values should receive the most attention in order to obtain more accurate estimates through ongoing research and analysis of the epidemic in real time.
The Importance of the Model’s Perspective:
The fourth and final point to introduce about models is the concept of perspective. All models approach a problem from a particular viewpoint or perspective – it could be from the specific viewpoint of patients (those who become infected), of the public (those who are at risk of infection), of the health care providers (those who have to treat the infected), of the health care systems (those who have to organize the care of those infected), of the health care insurers (those who have to pay for the care), or the government (those who are ultimately responsible for the net effects of the epidemic on population health and the economy). So what perspective do the current COVID-19 models take? This is one area where I think the modelers have been less clear about. But if you take this central figure of the Imperial College study that was first published in March,[8 ]the Y axis reveals what the modelers’ perspective is.

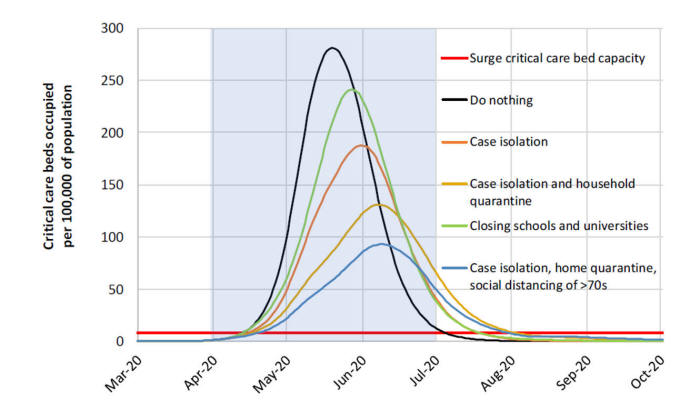
By modelling the number of ICU beds available and showing the critical care bed capacity for when the system would be overloaded, it is apparent that this model is taking a health care systems perspective. Most of the current models also track the total number of deaths - reflecting a public health perspective. Clearly, there are other relevant perspectives besides the health care system to consider ….. like the economy. Unfortunately, none of the COVID-19 models thus far have adopted what’s known as a societal perspective. Models that adopt a societal perspective attempt to capture all of the relevant perspectives at play, including the direct effects of a given health concern (e.g., cases, deaths, hospitalizations) as well as the indirect effects -- often expressed in terms of indirect costs (i.e., the economic impacts).
Perhaps a COVID-19 model that attempts to take a true societal approach would be so complicated that it would not be useful – given the myriad of input values required it would be vulnerable to a lot of criticism. But models that integrate more than just direct health care consequences of the pandemic are needed. I believe this is, in part, the origin of the current rancorous political debate about the stay-at-home orders. Without models that integrate both public health and economic impacts the answer to the question, ‘Is the cure worse than the disease?’ is impossible to determine objectively. It’s clear that some of the citizens who want social distancing rules removed and the economy opened up don’t feel like they are being heard right now. Without integrated models that consider both the public health and economic consequences, this fierce debate will likely continue.
If we can develop models that explicitly model the economic, social, and health effects simultaneously, then maybe we can get to a more rational middle ground to achieve the right balance of mitigation and control strategies.
Achieving the right balance of mitigation and control strategies demands that we consider the economic, social, and public health consequences of the pandemic simultaneously. For example, what are the combined health and economic consequences of opening up public schools? Or small businesses? As we head into the summer of 2020 it is clear that COVID-19 is going to be around for a while – easily into 2021 and maybe beyond. It is also clear that the shutdown of our normal way of life including our educational and economic engines is only sustainable for so long – it’s not a matter of if we reduce these control orders but when and how to do it. To strike this balance, we need new models that integrate epidemiological and economic data to weigh the alternatives. Such integrated models are a necessary, although probably insufficient, next step towards safely reopening our economy. Developing such models is a big and complicated task, one that will require both public health and economic modelers to work together on. But we need these models soon.
Acknowledgements
I am grateful to the feedback received on earlier drafts from Dr. Gustavo de los Campos, Mr. Brent Strong and Ms. Madeline Reeves.
References
1. Pandemic Influenza Outbreak Research Modelling Team. Modelling an influenza pandemic: A guide for the perplexed. CMAJ. 2009;181:171-173
2. Anderson RM. The role of mathematical models in the study of HIV transmission and the epidemiology of AIDS. Journal of AIDS 1988;1:241-256
3. Chowell G, Nishiura H. Transmission dynamics and control of Ebola virus disease (EVD): A review. BMC Medicine. 2014;12:196
4. Ferguson NM, Donnelly CA, Anderson RM. The Foot and Mouth Epidemic in Great Britain: Pattern of spread and impact of interventions Science. 2001;292:1155-60.
5. Brauer F. Mathematical epidemiology: Past, present, and future. Infect Dis Model. 2017;2:113-127
6. Hethcote HW. Three Basic Epidemiological Models. In: Applied Mathematical Ecology. Berlin Springer-Verlag; 1989.
7. Ridenhour B, Kowalik JM, Shay DK. Unraveling Ro: Considerations for Public Health Applications. AJPH. 2014;104 e32.
8. Ferguson NM, et al. Imperial College COVID-19 Response Team. Impact of non-pharmaceutical interventions (NPIs) to reduce COVID-19 mortality and healthcare demand. March 16, 2020.